Power BI

Slicers Vs Filters

What are slicers ?

What are filters?

How are they different from each other?

What and When should be used?

Well lets see,

Slicers and filters are almost the same except for some small differences. And which should be used at which time totally depends.

  • Slicers are displayed on the report canvas, so it provides a clear picture on what the data is all about and whether the data has been filtered or not and if so, what are the filters at a glance. Whereas filter selections need be expanded to be used as well as to see the filters used.
  • Slicers are available in the report canvas consuming report space, where are filters are not. So if you have lot of visuals and have concerns on slicers consuming more space then go for filters.
  • If the filters need to be used frequently for the reports then slicers are the best choice, unlike filters considering the ease of access.
  • Filters can be set for:

Visual level

Page level

Report level

Suppose you need to set different level of filters for the visuals in a page, simply avoid filters for some visuals this can only be obtained by slicers.

For an example in the given below example I want the units sold by country visual to represent units sold across all the countries. So, this can be easily obtained by setting filter none in edit interactions.

Just click on the relevant slicer in the example the country and click on “Edit Interactions” (Visual Tools -> Format -> Edit Interactions) and click on the None icon for the chart which you do not want to be filtered.

slilcer2

slicer3

Using filters visual level filters can be provided, where you need to set the filters for each and every visual individually.

  • Filters provide a range of options as Top N, Bottom N, Less than, Greater than, Less than or equal, etc.

But Slicers only provide a limited number of filtering options.

  • Sync Slicer option

Once you create the slicers on one page, of course you can copy and paste the slicers on to the other page. But what if you have a handful of pages in your report? And what if you have a considerable number of slicers as well. Well that’s where the Sync slicer option comes in handy, with some other features which adds some icing to the piece of cake.

With the Sync Slicer option, the slicers set in one report can be synced to the other pages of the report. So not only you can duplicate the slicers on to the selected reports with just couple of clicks, but also enables you to sync them for better user experience.

This can be done in 3 ways.

Method 1

slicer5.PNG

First enable the option Sync Slicer under view.

Then click on the relevant slicer. Now in the Sync Slicer pane we can enable the sync of the slicers in the other reports as well.

In the example given above The country slicer is available in page 1,

is also available and visible in page 2 and page 4. (Note the checkbox under the eye symbol).

In page 3 the country slicer is not visible but the data is synced. So if the user has selected France in page 1 page 3 will also reflect the data related to France.

In Page 4 the Country slicer is available, but it is not synced with the Page 1 country slicer data. So the country selected in page 1 will not be passed to the country slicer in page 4.

So, on and so fort the slicer option provides a bit flexible operations when compared with filters.

Method 2

Sync

First enable the option Sync Slicer under view.

And under advance options give a name to the sync group and you can give the same name to any slicer, which uses the same column and those slicers will be synced.

Method 3

slicer6.PNG

Of course, you can copy and paste as the traditional way. And then power bi will prompt a question asking if you want to sync the two slicers just as given below. Which you can change anytime you want.

So likewise slicers and filters have unique features as well as different types and different levels of limitations. What and where to be used is the totally the developers call.

So think wise and work wise.


Power BI

Power BI Storage Modes

Lets look at the storage modes of Power BI Data sources.

There are 3 types of storage modes as:

  1. Import
  2. DirectQuery (DQ)
  3. Dual

Based on our example all the tables including FactInternetsales table is in DirectQuery Mode, since we used DirectQuery to retrieve data in the first place.
How about Sales Aggre?

Well when creating the aggregated table what Power BI does is it imports the relevant columns (Column used for grouping as well as the newly created aggregated columns) and creates a smaller version of the original table FactInternetSales, and saves it in the memory just as it is done when data is being imported into Power BI.

The 3rd type of storage mode is Dual storage. It is a hybrid version of the Import and DQ, which enables tables to act as either Import or DQ based on the relationship to the other tables.

Since DimDate, DimCustomers, and DimProduct tables are related to both the Sales Aggre and the FactInternetSales tables, lets set the storage mode of these 3 tables into Dual mode.

Apart from these tables any other tables, which have relationships with both the original and these aggregated tables, will also be converted into dual mode by Power BI and a notification may pop-up stating this.

So, as a result of creating an aggregated table possible we’ll end up having a composite model with tables in all types of storage modes:

FactInternetSales – DirectQuery Mode

Sales Aggre – Import Mode

DimDate, DimCustomers, and DimProduct – Dual Mode

Any other tables, which have relationships with both FactInternetSales and Sales Aggre – Dual Mode

All other tables – DirectQuery Mode


a

b


Power BI

Power BI Aggregation tables

An Aggregation table is simply a smaller imported version of the original large DirectQuery table, which also can be considered as a solution for performance optimization when using larger DirectQuery tables.

Creating an Aggregated Table

Now we will be creating an Aggregated table for FactInternetSales.

In order to do so,

Go to Edit Queries and create a reference table from the FactInternetSales table.1.PNG

We have renamed the Reference table as Sales Aggre.

Now lets select the Sales Aggre table and select Group by under Transform.

2.PNG

The advance option enables to group by based on multiple columns.

3.PNG

As shown in the example click ok once the name for the measures, the aggregation desired and the column to be the aggregated is provided.

The column is unnecessary when a count of rows is to be aggregated.

4.PNG

Note: It is mandatory for the data types of the original source table and the aggregated table to be matched.

Ex:  FactInternetSales[SalesAmout] -> Decimal i.e.: Sales Aggre[TotalSalesAmout] -> Decimal

It is also mandatory to set the data type to Whole Numbers for the aggregated Count of Rows columns.

5.PNG

Create the relationships among the aggregated table and the Dimension tables based on the key as Usual as shown above.

Once the Aggregated table has been created the next important step is to configure the aggregations.

The manage Aggregations option can be found when right click on the Aggregated table.

6.png

At this step the columns which are used for grouping, the aggregated columns as well as the aggregations should be configured as given above.

As the final step hide the aggregated table. The table will be set to hidden automatically. If not set it to be hidden from the report view.

Now all is set to go.

Whenever the aggregations created in the Sales Aggre table are used in the report the Power BI will switch to the smaller aggregated table, which is in imported mode and when further data is required, which are available in the Original FactInternetSales table Power BI will switch to the original table in DirectQuery mode. And the best part is all these performance related activities are executed in the backend automatically.


Power BI

Power BI Composite model

What is a composite model in Power BI?

Composite model is a data model, which is built on a combination of imported data and DirectQuery data.

In short, Power BI composite model means a part of the data model having data from a DirectQuery to the data source and the other part being an imported data.

Given below is an example for a composite model.

Among the tables:

DimCustomers is in import mode and all the other tables including FactInternetSales Table are in DirectQuery mode.

Which tables in which mode is totally the developers call, which can be decided based on the data structure and the frequency of data refresh.

InternetSales


DimCustomers.PNG

Building and using a composite model enables to obtain a mix of the advantages of DirectQuery and Import data sources.

When designing and implementing the data model,

The import mode can be considered where data rarely changes to enhance the performance of the visuals in the report as well as the DirectQuery Mode can be considered for Dimensions, Facts or tables where constant data refreshing is required.

Python

Data Cleansing with Python

Poor quality data with enormous amounts of issues or in other words dirty data will lead into dirty reading as well as misleading decisions. Especially Data Scientist spends hours and hours when it comes to cleanse data.

As the first tutorial of this series of tutorials we’ll learn how to cleanse data step by step in order to obtain data with high quality, to be used not only for data science, but also in BI.

The first issue we’ll be looking into is:

  • Data with Multiple pieces of information in one column

a8

First things first, before we move on with the data cleansing first we need to load the data as well as the panda library, which we’ll be using.

a1

Split: Function as the name implies, splits a string value in to chunks or smaller strings based on a delimiter. Space is the default delimiter. This is exactly the opposite of concatenation.

a2

The split function is applied to the name column of the data-set and ‘,’ has been provided as the delimiter for the split.

By using assessor str we enable the column ‘name’ values to be treated as string values.

The results of the split is assigned to a variable called New_Name

a3

a4

So likewise simply by using the split () we can split column data.

So now let us look how to assign the split values into a new column of the data-set.

a5

Using the variable New_Name we are getting the first item from the variable list and assigning the value.

It is simple as that.

Now let us see how to obtain the same results in just one go.

a6

By setting the expand parameter set to true in Split function instead of a list we can obtain a data frame.

So multiple new column values can be created by splitting a single column values in one go can be achieved with the use of Split function and the expand parameter.

a7

So in the next tutorial we’ll look in how to obtain only a subset of data-set removing all the unnecessary columns and move on with the data cleansing process.


Power BI

Power BI – Data Refresh Scheduling

What is data refresh scheduling?

The datasets used to build dashboards/reports should be updated in a timely manner as the data in the source will continuously get updated. This update can be scheduled, so that the data will refresh providing up-to-date data to the end user.

Why data refresh scheduling is so important?

The availability of latest data in the report is a critical requirement when it comes to reports and dashboard since it has an impact on the accuracy of the decisions taken using the reports or the dashboards.

The data on the other hand will keep on changing and updating.

When the data should be refreshed?

The changes and the frequency of the updates totally depend on the type of the data and the type of the domain. So the data refresh can be scheduled based on the frequency of the data updates.

How to schedule data refresh in Power BI?

Power BI playing a leading role among the modern reporting tools, also provides the data refresh scheduling feature in a simplest manner, which enables the Power BI self-service more meaningful and easy for the business end users.

The following are the easy steps to be followed to schedule a data refresh.

  • Before the data refresh scheduling the credentials for the data-set should be provided in the web portal.
  • Now under the relevant work space, in which the data-set is available click on the data-set and the click on the scheduled refresh.

1

  • Enable the refresh schedule and select the refresh frequency (Daily, Weekly)

2

  • A required time slot also can be set.

3

Note: A data-set will be considered as inactive when no users has visited the dashboards or reports built using the data-set over a period of 2 months. The refresh schedules of Inactive data-sets will be set to off and a notification mail will be sent to the data-set owner. By visiting the dashboards/reports built on such inactive data-sets the refresh schedule can be activated.

SSIS

Data Profiling

What is a SSIS Data Profiling Task?

SSIS has a component which performs data profiling, and output the profile of the data as a report.

The Data Profile Task analyses and provides an insight of the data which is very useful in understating as well as identifying the quality issues of the source data. Data profiling task can also be useful in defining the targets for the datasets.

Component

How to configure a SSIS Data Profiling Task?

  • First double click on the Data Profiling Task.

Window1

  • First and foremost the destination is required to be configured, which will be used to store the profile data in an XML format. The destination type can be either a file connection or a variable.

Window6

  • For this example we’ll use File Connection as the destination type.
  • You will be required to select a new connection and set the connection for the first time.

Window7

  • The profiler can be set to create a new file as well as to use an existing file.

Window8

  • Select the desired file type and file and click on OK.
  • Next to configure the profiling checks click on the Quick Profiler and the following window will appear.

Window2.png

  • Select the Target data connection from the drop down menu of ADO.NET Connection. (If no connection is available, click on New and create a new connection.)

Limitation: Profiling Task can only profile SQL Server database data.

(If having the data in a different platform, first load the data into the SQL Server database in order to profile the data)

  • After creating the connection select the required database and the table.

Window4.png

  • Select the required data checks.

Data profiler provides a number of different data checks as follows:

  1. Column Null Ratio Profile: Percentage of Null records of all the columns of the selected table.
  2. Column Statistic Profile: Minimum, Maximum and standard deviations of the column values.
  3. Column Value Distribution Profile: Pattern of repeating data as well as the percentage of total repeats.
  4. Column Length Distribution Profile: Length of the strings, as well as the occurrence of the length across the columns.
  5. Column pattern profile: Reveals a set of regular expressions in a string column. Identifies invalid strings as well as provides suggestions of regular expressions, which can be used to validate new values for the dataset.
  6. Candidate Key Profile: Identifies the candidates, which can be used for the primary key constraint.

When using the Candidate Key Profile, an additional option is available to be selected as the no. of columns to be considered at a time.

E.g.: 2 – a combination of 2 columns for candidates for the PK constraints.

  1. Functional Dependency Profile: Compares columns to profile the dependencies of the data.

The no. of columns to be considered at a time also can be set using the ‘for up to’ option same as above.

  • After selecting the required data checks click on OK.

Window5.png

  • Click on OK again.
  • As now the Data Profiler is all configured execute the task.

Window9.png

  • Once the task in executed successfully, double click on the profile task and click on Open Profile Viewer to open the profile report.

Window10.png

  • If multiple profile tasks have been executed, once clicked on Open Profile Viewer the most recently generated data profile will be launched.

Window11.png

The different profiles generated can be viewed as follows.

  1. Candidate Key Profiles.

CKP.png

  1. Column Length Distribution Profiles.

CLDP.png

  1. Column Null Ratio Profiles.

CNRP.png

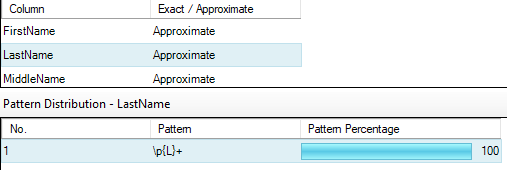
  1. Column Pattern Profiles.

CPP.png

  1. Column Statistics Profiles.

CSP.png

  1. Column Value Distribution Profiles.

CVDP.png

  1. Functional Dependency Profiles.

FDP.png

As the profile report will be saved in an XML format, it can be used to consume to any application as well.

SSIS

SSIS logging methods

Information on currently executing as well as details on executed packages can be obtained by SSIS Loggings. These logging details are useful for a variety of reasons. SSIS packages bug fixing, performance monitoring as well for fine tuning can be given as some common scenarios. Some commonly used methods for these purposes are:

  • Using SSIS build-in Reports.
  • In-build logging feature of SSIS and querying the logs tables.
  • Using Event handlers.
  • Custom build queries using SSISDB tables and catalog views.
  • Implementing SQL Tasks to log into customized log tables, when necessary (at the beginning and at the end of packages).

Method No.

  1. SSIS build-in Reports.

One of the widely used logging feature of SSIS. Reports of validations as well as executions are available for monitoring purposes.

SSIS In-build Reports
1. SSIS build-in Reports

2.  In-build logging feature of SSIS and querying the logs tables.

The following are the steps to be followed for enabling logging feature of SSIS in order to query the logs tables, to achieve package level logging information.

  • On the menu, select SSIS (or right click while in the control flow) –> Logging.
  • On the Configure SSIS Logs: Select the required provider type and click on Add. Check the name checkbox and provide the connection for the data source under configuration column. Once this is done SSIS will create a table as dbo.sysssislog and a system stored procedure as dbo.sp_ssis_addlogentry in the database that you have provided.
  • Select the Details tab and you may select the events on which you required execution details to be logged.
dbo.sysssislog
SSIS build-in Reports

3. Using Event handlers.

This is another option to track package progress. Although this option provides the flexibility of performing different tasks on a particular event apart from logging the information, the downside of this option is that it requires the settings to be done everywhere in all the packages as required. But definitely for a lesser no of packages it’s a minor concern. It’s totally up to the developer to decide based on the requirement and the scenario.

EventHandlers
SSIS Package Event Handlers

4. Custom build queries using SSISDB tables and catalog views

The SSISDB Catalog is the central when working with SSIS Packages, which stores a list of SSIS related objects as well as tables with operational history of all of the deployed SSIS projects. This also comes in handy when querying the execution process of SSIS packages.

For an example:

catalog.executable_statistics in combination with catalog.executables can be used to identify the longest running objects in a package.

—– top five longest running objects in the package.

USE SSISDB

SELECT TOP 5 ex.[executable_name], es.[execution_duration]

FROM [catalog].[executable_statistics] AS es

LEFT JOIN [catalog].[executables] AS ex

ON es.[execution_id] = e.[execution_id]

WHERE ex.[execution_id] = 2

ORDER BY [execution_duration] DESC

——- A View on package execution event information

CREATE VIEW [dbo].[VWPackageExecutionStaus]
AS
SELECT
om.operation_message_id
, om.operation_id
, op.[object_name] Project
, ev.package_name Package
, om.message_time [Date]
,CASE om.message_type
WHEN 120 THEN ‘package failed’
WHEN 130 THEN ‘Task Failed’ ELSE ‘Package Succeed’
END AS [Package Status]
,CONVERT(DATETIME,op.[start_time]) AS [Start Time]
,CONVERT(DATETIME, op.[end_time]) AS [End_Time]
,DATEDIFF(s, op.start_time, op.end_time) AS [Package Duration]

FROM
[SSISDB].[internal].[operation_messages] AS om
INNER JOIN [SSISDB].[catalog].[event_messages] AS ev ON ev.operation_id = om.operation_id
INNER JOIN [SSISDB].[internal].[operations] AS op ON op.operation_id = ev.operation_id

GO

5.  Apart from SSIS in-build logging tables customized tables for logging purposes also can be build and used within the SSIS packages.

——-Table PackageLogDetails

CREATE TABLE PackageLogDetails

(

[PackageLogDetailsID] [int] IDENTITY(1,1) NOT NULL,

[PackageName] [nvarchar](100) NOT NULL,

[StartTime] [datetime] NOT NULL,

[EndTime] [datetime] NULL,

[Success] [bit] NULL CONSTRAINT [DF_PackageLogDetails_Success]  DEFAULT (0)

)

GO

——- Procedure sp_SPackageLog

CREATE PROCEDURE sp_SPackageLog @PackageName nvarchar (100)

AS

BEGIN

INSERT INTO PackageLogDetails (PackageName, StartTime )

VALUES (@PackageName, GetDate() )

END

SELECT MAX(PackageLogDetailsID) FROM PackageLogDetails WHERE [PackageName] = @PackageName

——- Proc sp_EPackageLog

CREATE PROCEDURE sp_EPackageLog @PackageLogDetailsID INT

AS

BEGIN

UPDATE dbo.PackageLogDetails SET EndTime = GetDate() , Success = 1

WHERE PackageLogDetailsID = @PackageLogDetailsID

END

Customized_ETL
Logging Package execution with Customized log tables